


#179: The Music of Data
What does the data about our individual and collective music tastes reveal?

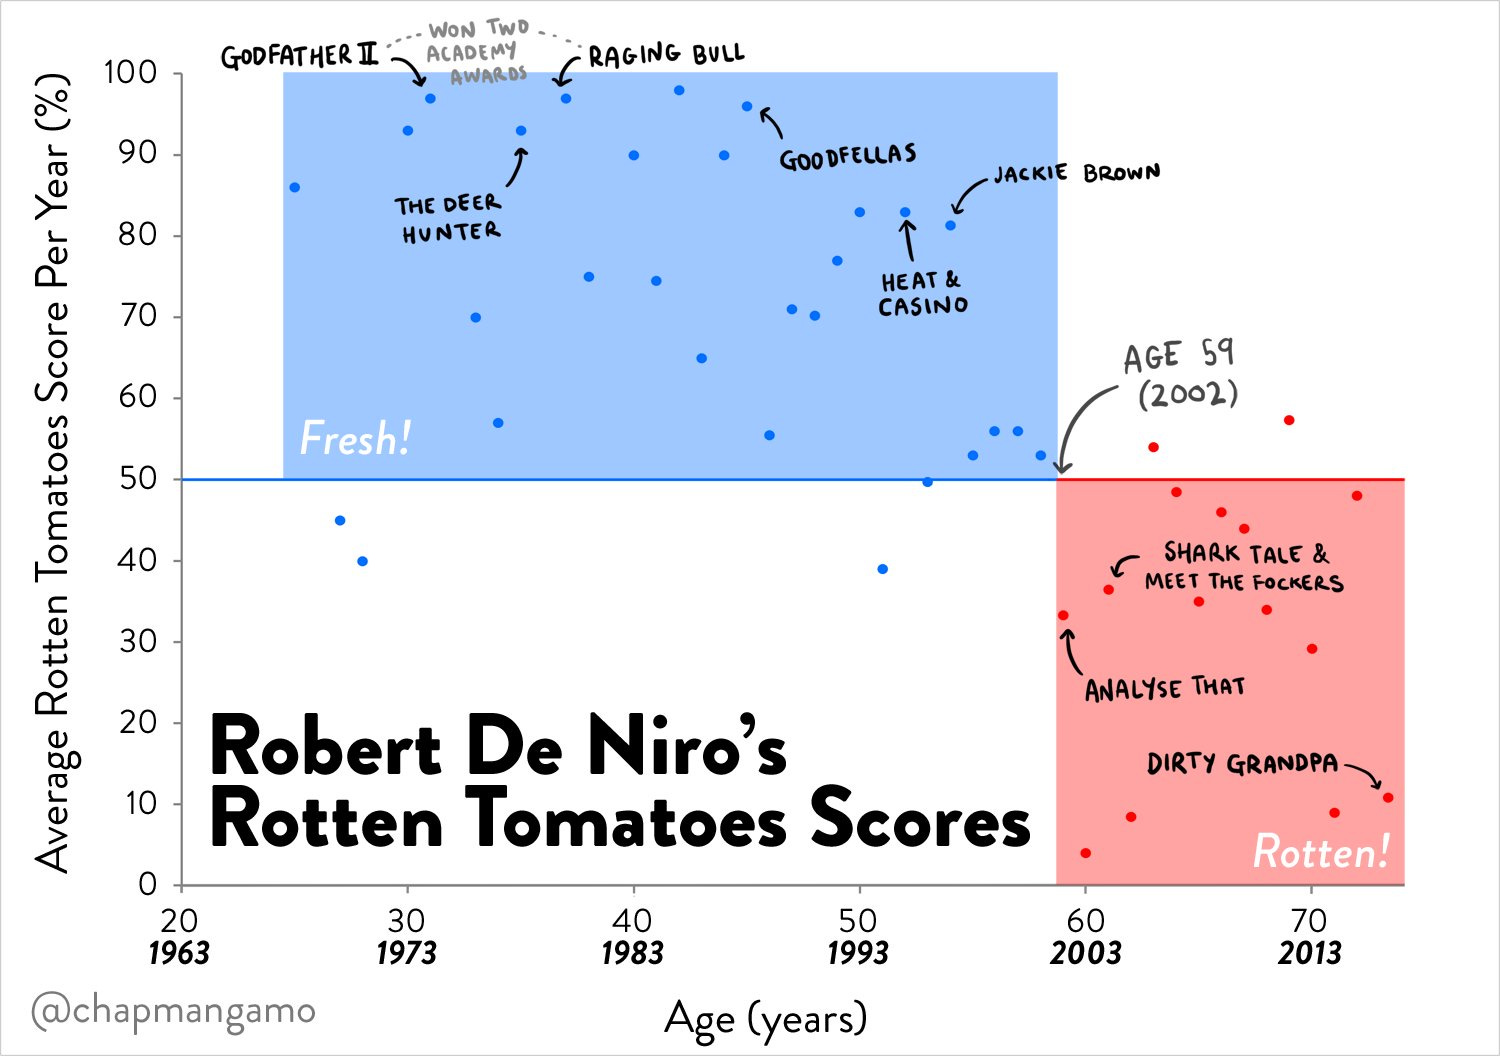
One of my favourite data stories of all time was the question: "When did Robert De Niro stop giving a s**t?"
Because, as it turns out, this is actually a question that can be answered with data!
But this week, something even more fascinating has caught my eye.
First, though, a digression.
Some of you may have heard about this idea, that our music tastes can say a lot about ourselves, such as our levels of intelligence. There's been a bunch of attempts to correlate in the past. Such as this plot of SAT Scores against the type of music preference. Or this one also correlating SAT scores, which seems to be much referenced on various boards, and blogs. I haven't found any real validation of this, or any scientific review or verification. So I'll just leave it there. A somewhat more rigorous approach is adopted by this study at the University of Warwick, which suggests that gifted students may prefer heavy metal. Yet another study by the Oxford Brookes University in Croatia suggests that the more intelligent students tend to listen to 'wordless' genres such as jazz and classical. But there's no causation obviously. There is a scientific basis for why playing music improves memory and verbal intelligence, but that’s another discussion entirely.
Yet another direction of popular analysis has been correlating music tastes with political views. It has been often cited that country music stars such as Garth Brooks are more likely to be found on republican voters' playlists, while Madonna is more likely to figure on the playlists of democrat leaning citizens. There have been a few versions of this as well. This survey of a thousand fans shows that while Rock and Pop are common to all, Republicans do listen to country, and in fact the Garth Brooks trope makes an entry as he's the highest ranking musician for Trump supporting respondents. Brooks also scores high with pro-gun respondents, and those opposed to same-sex marriage, so there you have it. A broader study published in Digg shows you an interactive map, created by ticket stub data based on concert ticket sales, which plots the most popular genres of music by county, against the Clinton v Trump election result of 2016.

This is correlation based on commonality of causes. For example, young people like Converse and SuperDry, and they also have higher car insurance premiums, so people who wear Converse tend to have higher insurance premiums, but not because of their footwear choices.
So, back to what I was saying. The Economist published an interactive graph this week using Spotify data, and showing the decline of English music, compared to Spanish and local languages. There's a lot of detail there, but it probably throws a light on some cultural mores. The real nugget for me was yet another research recently published and covered in the HBR, which suggests, intriguingly, that across countries, markets do well when people listen to happy songs. Could this also be one of those based on common parameters? Perhaps, but the research clearly suggests that markets did well the day after happy songs were played, so it's definitely not the market upturn that's driving the mood of the music.
The idea that our music data tells many more things about us - politically, socially, intellectually, is not surprising, even though some of the findings may be questionable. It’s a reminder that data leaves a trail that can tell other stories, directly or indirectly. Also, the relationship between variables could be a causal one, or a correlation without causality. But the latter is still useful for decision making. Your music tastes don't make you a left or right leaning person, politically. Nor do your politics determine your music. But to be able to target specific political views during an election campaign via YouTube, Spotify, or on radio is nonetheless valuable, and actionable.
But the real game changer here is how these correlations are studied. You can see that all the earlier inferences were based on collecting data through structured studies and samples. Today we just have to get the Spotify api and you could be observing population scale data. Think of the volume of data Google, FaceBook, Apple et all have, which is potentially usable for socio economic and longitudinal analyses. A sociologist would sell his soul to get their hands on this dataset! Perhaps the music fingerprint is just the tip of the iceberg, a gateway to a new world of understanding about ourselves.
Reading This Week
Managing Innovation: I enjoyed this model of ‘6 Problem Solving Mindsets for Uncertain Times’ from McKinsey, especially as it resonates with our innovation mindset. Curiosity, ambiguity, collective wisdom, show and tell, wide-angle views, and continuous experimentation based on ‘occurrent behaviours’. (McKinsey)
Product Innovation: If I asked you to think about ways in which you could improve on the camera of today, I’m guessing that one of your answers would NOT be to capture less of what’s actually in front of the lens. Yet, that’s exactly what this new type of event based camera does. (Economist)
Health & Wellness: This is another good piece from McKinsey about the length and breadth of the global wellness market. (McKinsey)
Quantum Computing: A useful guide to quantum computing. (HBR)
AI / Robotics: Robots vs Children (a colouring competition, not a gladiatorial battle!) Below.
Extra-curricular: Nothing to do with tech, but a fascinating account of an FBI agent who spent 25 years infiltrating white supremacist gangs, and terror cells.
Have a great weekend!
Ved